Datos personales

Romeo. Con la tecnología de Blogger.
RSS
Mostrando entradas con la etiqueta La tierra. Mostrar todas las entradas

sistema de mapeo móvil Stencil Pro


$$$$$$$$$$$$$$$$$$$$

sistema de mapeo móvil Stencil Pro


$$$$$$$$$$$$$$$$$$$

Kaarta anuncia el sistema de mapeo móvil Stencil Pro
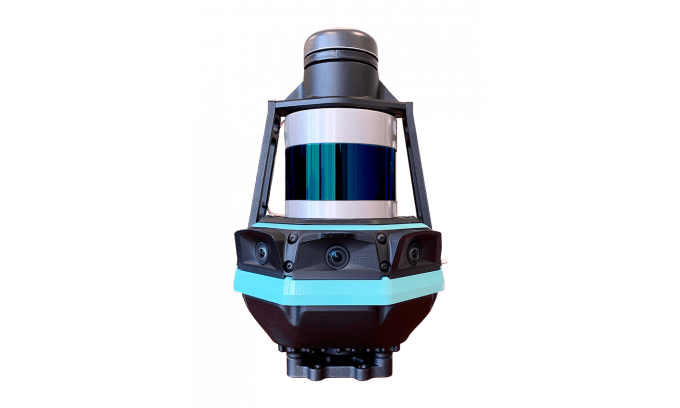

Kaarta, especialista en captura de realidad 3D móvil en tiempo real, presenta Stencil Pro, una plataforma de mapeo móvil de nivel profesional con fidelidad visual y dimensional de alta calidad. El sistema de mapeo móvil Stencil Pro multipropósito proporciona resultados precisos con una velocidad impresionante, incluso en entornos desafiantes como minas subterráneas o corredores de servicios públicos.
Stencil Pro, un sistema todo en uno para escanear, procesar y ver los datos capturados en tiempo real, ofrece imágenes panorámicas 4K de alta definición y nubes de puntos coloreadas. Con una sólida percepción de la vista envolvente en una amplia gama de condiciones de luz, Stencil Pro está optimizado para el rendimiento tanto en interiores como en exteriores. Con un Lidar de 32 líneas de alta densidad y bajo ruido con un alcance de 120 metros y una velocidad de datos de 600,000 puntos por segundo, Stencil Pro produce un modelo 3D de alta precisión en minutos.
Con una clasificación IP65, Stencil Pro está protegido contra elementos adversos como la suciedad, el polvo, la niebla y la lluvia, por lo que es la herramienta ideal para el mapeo de infraestructura, minería, silvicultura, movimiento de tierras, construcción y otros entornos hostiles. El diseño resistente y versátil de Stencil Pro se adapta a muchos entornos, capturando datos en medio de mal tiempo, entornos de trabajo polvorientos y cavidades subterráneas o cuando se monta en vehículos, locomotoras, vehículos todo terreno y otras plataformas.

Geo-habilitado para muchas aplicaciones

Al igual que todos los sistemas Kaarta, las capacidades de localización y mapeo simultáneo (SLAM) de Stencil Pro significan que opera en áreas denegadas por GNSS, como interiores, subterráneas, bajo cubierta o en cañones urbanos. Sin embargo, también está totalmente habilitado para muchas aplicaciones, como el mapeo de calles, corredores y ferrocarriles, donde la adición de una señal GNSS es altamente beneficiosa. Stencil Pro integra el probado y verdadero receptor Trimble BD-990, la antena AV-28 y una gama de otras antenas GNSS de terceros. Admite mejoras de precisión de posicionamiento a través del procesamiento RTK / NTRIP en vivo, así como correcciones PPK basadas en datos proporcionados por la red NOAA CORS o una estación base suministrada por el usuario. Los datos de posicionamiento GNSS se utilizan para alinear y geo-registrar datos, proporcionando precisión global y mejorando aún más la fidelidad de los escaneos de área grande y las rutas de escaneo largas y lineales.
El GNSS integrado y las cámaras en color están completamente integradas en la captura en tiempo real, lo que permite la optimización de los datos recopilados y la flexibilidad en la salida. La ventaja del posicionamiento absoluto y la precisión junto con las tecnologías de imágenes de 360 ​​grados produce una nube de puntos de color verdadero, rico y robusto cuando es necesario. Si no se requiere una nube de puntos coloreada, o GNSS no está disponible, la confianza en otros sensores es perfecta.

Comprender las condiciones existentes

"Miles de millones de dólares en transacciones de bienes raíces comerciales, proyectos de construcción, mantenimiento de infraestructura y decisiones de gestión de recursos naturales dependen de la comprensión de los datos de las condiciones existentes", dijo Kevin Dowling, CEO de Kaarta. "Obtener datos actualizados para estos entornos es laborioso, lento y costoso con los métodos actuales. Incluso en los escenarios más desafiantes, Stencil Pro proporciona rápidamente las respuestas necesarias para que los gerentes tomen decisiones informadas".
Stencil Pro funciona con una entrada de 100-240 VCA (o 12V con un inversor) o con sus dos baterías intercambiables en caliente que duran hasta 3 horas de escaneo. La interfaz de usuario intuitiva de Stencil Pro simplifica la captura y el procesamiento de datos. La experiencia del usuario incluye escaneo de un botón, monitoreo de escaneo en tiempo real y opciones de post-procesamiento optimizadas para maximizar la claridad de los datos y la usabilidad. La operación remota con un monitor con pantalla táctil permite montar Stencil Pro en una multitud de transportes. Cuando se lleva a mano, el estado del escaneo se puede iniciar y detener con solo presionar un botón.
Stencil Pro se basa en Kaarta Engine , el enfoque pendiente de patente de Kaarta para resolver el problema de SLAM. La incomparable experiencia de Kaarta en localización, como resultado de sus profundas raíces robóticas, ofrece un error de deriva definitivamente menor que los sistemas SLAM alternativos en un orden de magnitud. La tecnología, la calidad y la precisión comprobadas de Kaarta son confiables por AEC, geoespaciales, gestión de recursos naturales y profesionales autónomos de robots móviles en todo el mundo.
%%%%%%%%%%%%%%%%%%

  • Digg
  • Del.icio.us
  • StumbleUpon
  • Reddit
  • RSS

3D Modelling for Property Valuation in China


$$$$$$$$$$$$$$$$$$$$$$

MODELADO

$$$$$$$$$$$$$$$$$$$$$

3D Modelling for Property Valuation in China

A High-resolution Remote Sensing-based Approach


Rapid urban development in China has transformed the cityscapes, with a dramatic increase in high-rise buildings. However, the current 2D property valuation methods neglect the vertical dimension, even though that aspect contains significant indicators that impact property value – such as types of views, scope of vision and daylight. 3D modelling of geographical data can help to change this in high-rise and high-density areas, going beyond 2D to enable identification of complex property characteristics in the vertical dimension too. This article presents research to explore a 3D modelling approach using remote sensing data for more precise property valuation.
The accelerating urbanization has put great pressure on land in China, posing a challenge of how to accurately define property characteristics and values. However, the integration of GIS and property valuation are mainly based on two dimensions. When it comes to handling the complexity of vertical developments in urban areas, current methods are incapable of describing a property’s 3D characteristics in detail and providing precise information on spatial variations between properties. In view of the considerable rise in property prices and the technical advancements in GIS, 3D modelling is becoming increasingly relevant for property valuation in urban areas in order to better describe the complex property characteristics, especially in the vertical dimension, as recent research in China shows.

Study area

Xi’an, the capital city of Shaanxi Province, is located in the mid-western area of China. Xi’an serves as the educational, political and economic centre of Shaanxi Province and wider northwest China. It also attracts tourists from around the world. Xi’an was chosen for the research project because of its data availability and its property market, which has particularly flourished over the past few years. Although it is both costly and time-consuming to investigate the effects of 3D indicators, the anticipated results at the neighbourhood scale can be useful, giving prospective buyers a fast estimate of the property price in a specific neighbourhood and also making the study feasible in terms of computation and data collection.
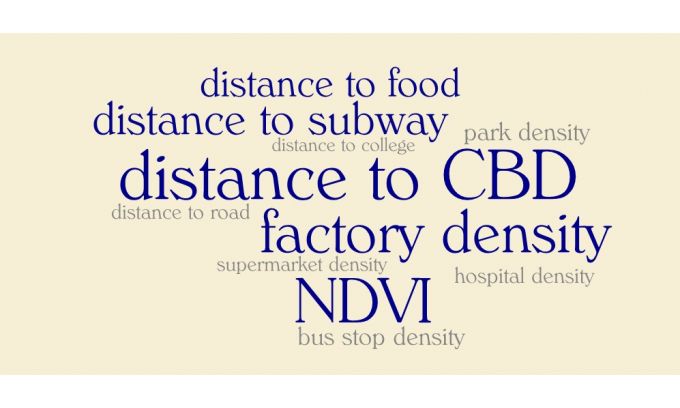
Figure 1, The 2D indicators included in the 2D model (Blue: significant at 0.05 significance level; Grey: not significant).

Higher level of detail

3D modelling and its interactive functions for property valuation has so far not been very popular among both the municipal government and the real-estate developers in Xi’an; it has only been explored by real-estate developers in a few large cities (e.g. Shenzhen). The Xi’an municipal government does use some 3D modelling, but mainly in the field of urban planning and the use cases are limited due to the low levels of detail (LOD) influenced by the huge cost, low technology and public security policy. However, 3D modelling can be developed to a higher LOD to serve more purposes in the future (e.g. emergency management). Real-estate developers utilize 3D modelling for architecture and landscape design, but they rarely use it for sales purposes because they believe/perceive the traditional 2D sales tools to be effective and intuitive. The reform of the Hukou policy has contributed to substantial population growth in Xi’an and is thus creating a higher demand for housing. Now that the property market in Xi’an is a seller’s market, the real-estate developers have no impetus to develop new technologies. Therefore, a suitable 3D modelling approach should be determined by considering the local circumstances.
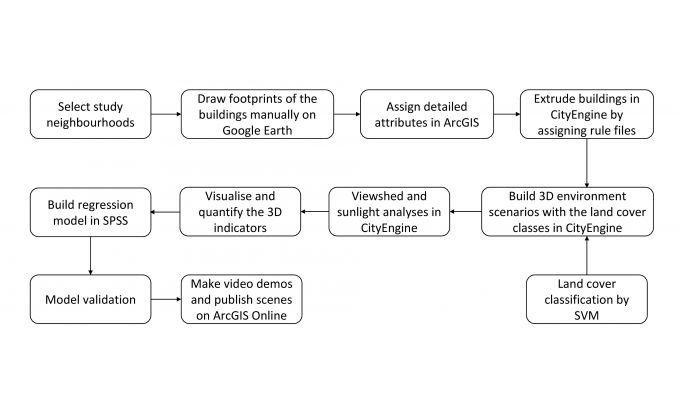
Figure 2, The 3D modelling workflow.

Exploring the 2D-based method

In this research project, first a regular hedonic price model with 2D indicators was applied. Generally, most research concluded that property price variations could be generalized by different statistical models. However, the R2 of 2D methods applied in this research, ordinary least squares (OLS) and geographically weighted regression (GWR) were too low to generalize a model (0.111 in OLS and 0.217 in GWR), which meant the models of current 2D indicators (Figure 1) could not explain the property price variations. The reason may be the use of first-hand property price data which was generated under the fixed-price and purchase-restriction policy established by the Xi’an municipal government, whose primary purpose was to stabilize property prices. Therefore, the prices may not show a significant impact from the geographical locations and surroundings.

The 3D modelling process and results

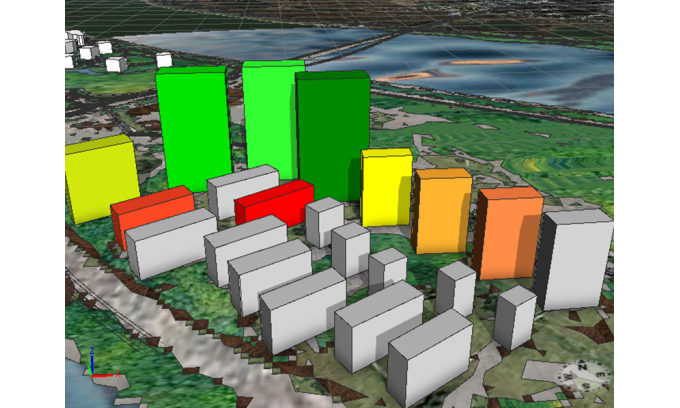
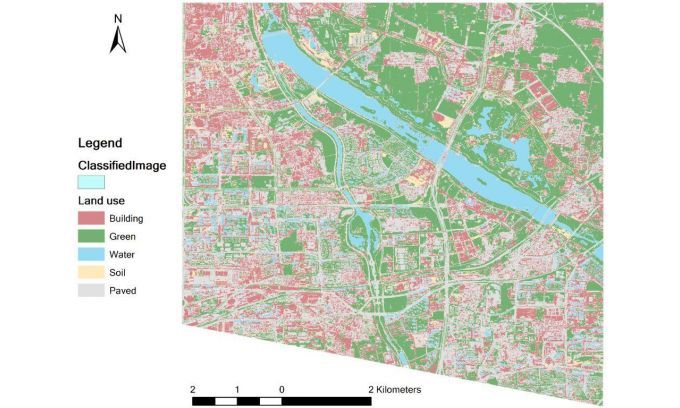
The preparation for a 3D model was divided into two main steps: land cover classification based on remote sensing data, and 3D data structure construction (Figure 2). The multispectral images used for the classification were from the Chinese satellite Gaofen-2, with a resolution of 4m, and Sentinel-2, with a resolution of 10m. The classification was executed by a support vector machine and validated by visual interpretation (Figure 3). 3D data structure construction was conducted in ArcGIS for creating height attributes for the 2D floor plans, which could be directly linked in CityEngine. In the 3D modelling process, two high-rise neighbourhoods were explored. The 3D indicators taken into consideration were view type, sky view factor (SVF), sunlight and property orientation. These were determined based on the local knowledge acquired by a questionnaire issued to Xi’an residents. The first three indicators were simulated by built-in functions in CityEngine: Viewshed and sunlight analysis. Property orientation was set up as a dummy variable. The regression results revealed that the R2 of the 3D method (0.451) was significantly higher than those of 2D methods. SVF, sunlight and property orientation were proven to have a significant influence on property price at 0.05 significance level. The findings disclosed that the 3D method could explain property price variations better than 2D methods. The 3D visualization in CityEngine also showed excellent performance regarding quantifying and analysing 3D indicators (Figure 4).
Figure 3, The classified image of the study area with an overall accuracy of 87.5%.

Validating the 3D model

The regression results of the 3D model were validated by leave-one-out cross-validation and the results turned out to be quite good, with a 9.76% error of predicting the property price. However, no research has ever set up a threshold or developed an approach for this kind of model validation. The analysis of the 3D indicators was all simulated in software and it would be time-consuming to collect them through fieldwork. Therefore, the validation of the 3D model will remain an important issue to be solved in the future.

A way forward

This research proved the 3D modelling approach, with its vivid visualization and powerful calculation, to be effective for high-quality property valuation. It shows a way forward in which property valuation can be conducted in a more comprehensive, precise and cost-effective way with high-resolution remote sensing data and 3D data structure support. Moreover, it can be widely implemented and adapted to other fields, e.g. for setting the price standards for future property tax in China. The researchers recommend more exploration in two aspects in particular. First, visualization and quantification of 3D indicators can be developed further. Accuracy can be improved with a higher LOD. Besides this, different calculation techniques may influence the research outputs, so it is necessary to develop an efficient method for quantifying 3D indicators. Second, this research contained a huge amount of manual work. Therefore, further exploration of automated techniques is recommended.
Acknowledgments
This work was supported by ITC and thanks are due to Dr Jong Wang and Dr Xia Li for data support.
Further Reading
3D scenarios of the neighbourhoods studied: http://bit.ly/2IEA3Wy / http://bit.ly/2Iyl4NJ
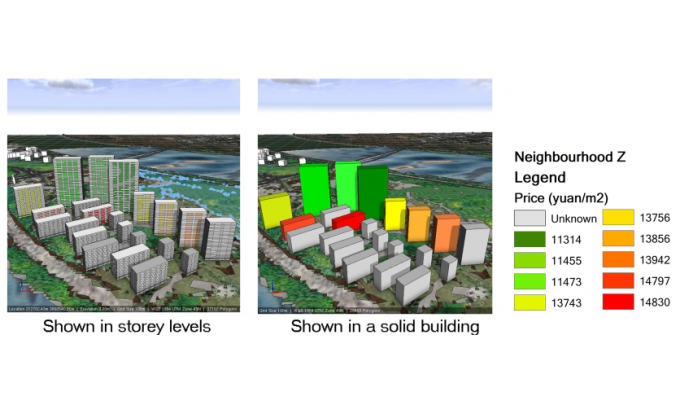
Figure 4, The property price variations of a sample neighbourhood shown in 3D at the neighbourhood scale.

&&&&&&&&&&&&&&&&&&&&&

  • Digg
  • Del.icio.us
  • StumbleUpon
  • Reddit
  • RSS

La tierra

Los científicos han podido reconstruir información detallada sobre el pasado de la Tierra. Según estos estudios el material más antiguo del sistema solar se formó hace 4567,2 ± 0,6 millones de años, y en torno a unos 4550 millones de años atrás (con una incertidumbre del 1 %) se habían formado ya la Tierra y los otros planetas del sistema solar a partir de la nebulosa solar, una masa en forma de disco compuesta del polvo y gas remanente de la formación del Sol. Este proceso de formación de la Tierra a través de la acreción tuvo lugar mayoritariamente en un plazo de 10-20 millones de años.La capa exterior del planeta, inicialmente fundida, se enfrió hasta formar una corteza sólida cuando el agua comenzó a acumularse en la atmósfera. La Luna se formó poco antes, hace unos 4530 millones de años.

Representación gráfica de la teoría del gran impacto.
El actual modelo consensuado sobre la formación de la Luna es la teoría del gran impacto, que postula que la Luna se creó cuando un objeto del tamaño de Marte, con cerca del 10 % de la masa de la Tierra, impactó tangencialmente contra ésta. En este modelo, parte de la masa de este cuerpo podría haberse fusionado con la Tierra, mientras otra parte habría sido expulsada al espacio, proporcionando suficiente material en órbita como para desencadenar nuevamente un proceso de aglutinamiento por fuerzas gravitatorias, y formando así la Luna.
La desgasificación de la corteza y la actividad volcánica produjeron la atmósfera primordial de la Tierra. La condensación de vapor de agua, junto con el hielo y el agua líquida aportada por los asteroides y por protoplanetascometas y objetos transneptunianos, produjeron los océanos. El recién formado Sol solo tenía el 70 % de su luminosidad actual: sin embargo, existen evidencias que muestran que los primitivos océanos se mantuvieron en estado líquido; una contradicción denominada la «paradoja del joven Sol débil», ya que aparentemente el agua no debería ser capaz de permanecer en ese estado líquido, sino en el sólido, debido a la poca energía solar recibida.Sin embargo, una combinación de gases de efecto invernadero y mayores niveles de actividad solar contribuyeron a elevar la temperatura de la superficie terrestre, impidiendo así que los océanos se congelaran. Hace 3500 millones de años se formó el campo magnético de la Tierra, lo que ayudó a evitar que la atmósfera fuese arrastrada por el viento solar.
Se han propuesto dos modelos para el crecimiento de los continentes: el modelo de crecimiento constante, y el modelo de crecimiento rápido en una fase temprana de la historia de la Tierra. Las investigaciones actuales sugieren que la segunda opción es más probable, con un rápido crecimiento inicial de la corteza continental, seguido de un largo período de estabilidad. En escalas de tiempo de cientos de millones de años de duración, la superficie terrestre ha estado en constante remodelación, formando y fragmentando continentes. Estos continentes se han desplazado por la superficie, combinándose en ocasiones para formar un supercontinente. Hace aproximadamente 750 millones de años (Ma), uno de los primeros supercontinentes conocidos, Rodinia, comenzó a resquebrajarse. Los continentes más tarde se recombinaron nuevamente para formar Pannotia, entre 600 a 540 Ma, y finalmente Pangea, que se fragmentó hace 180 Ma hasta llegar a la configuración continental actual.
%%%%%%%%%%%%%%%%%%%%%%%

  • Digg
  • Del.icio.us
  • StumbleUpon
  • Reddit
  • RSS